Reading your NeverMetered usage and requests pages
Updated 10 November 2026
You're never billed per token on NeverMetered, so the Usage and Requests pages aren't a bill. They're there so you can see what your agents are doing, why something felt slow, and whether you need more parallel streams. Every number below comes from the pages as they appear in your dashboard.
The Usage page
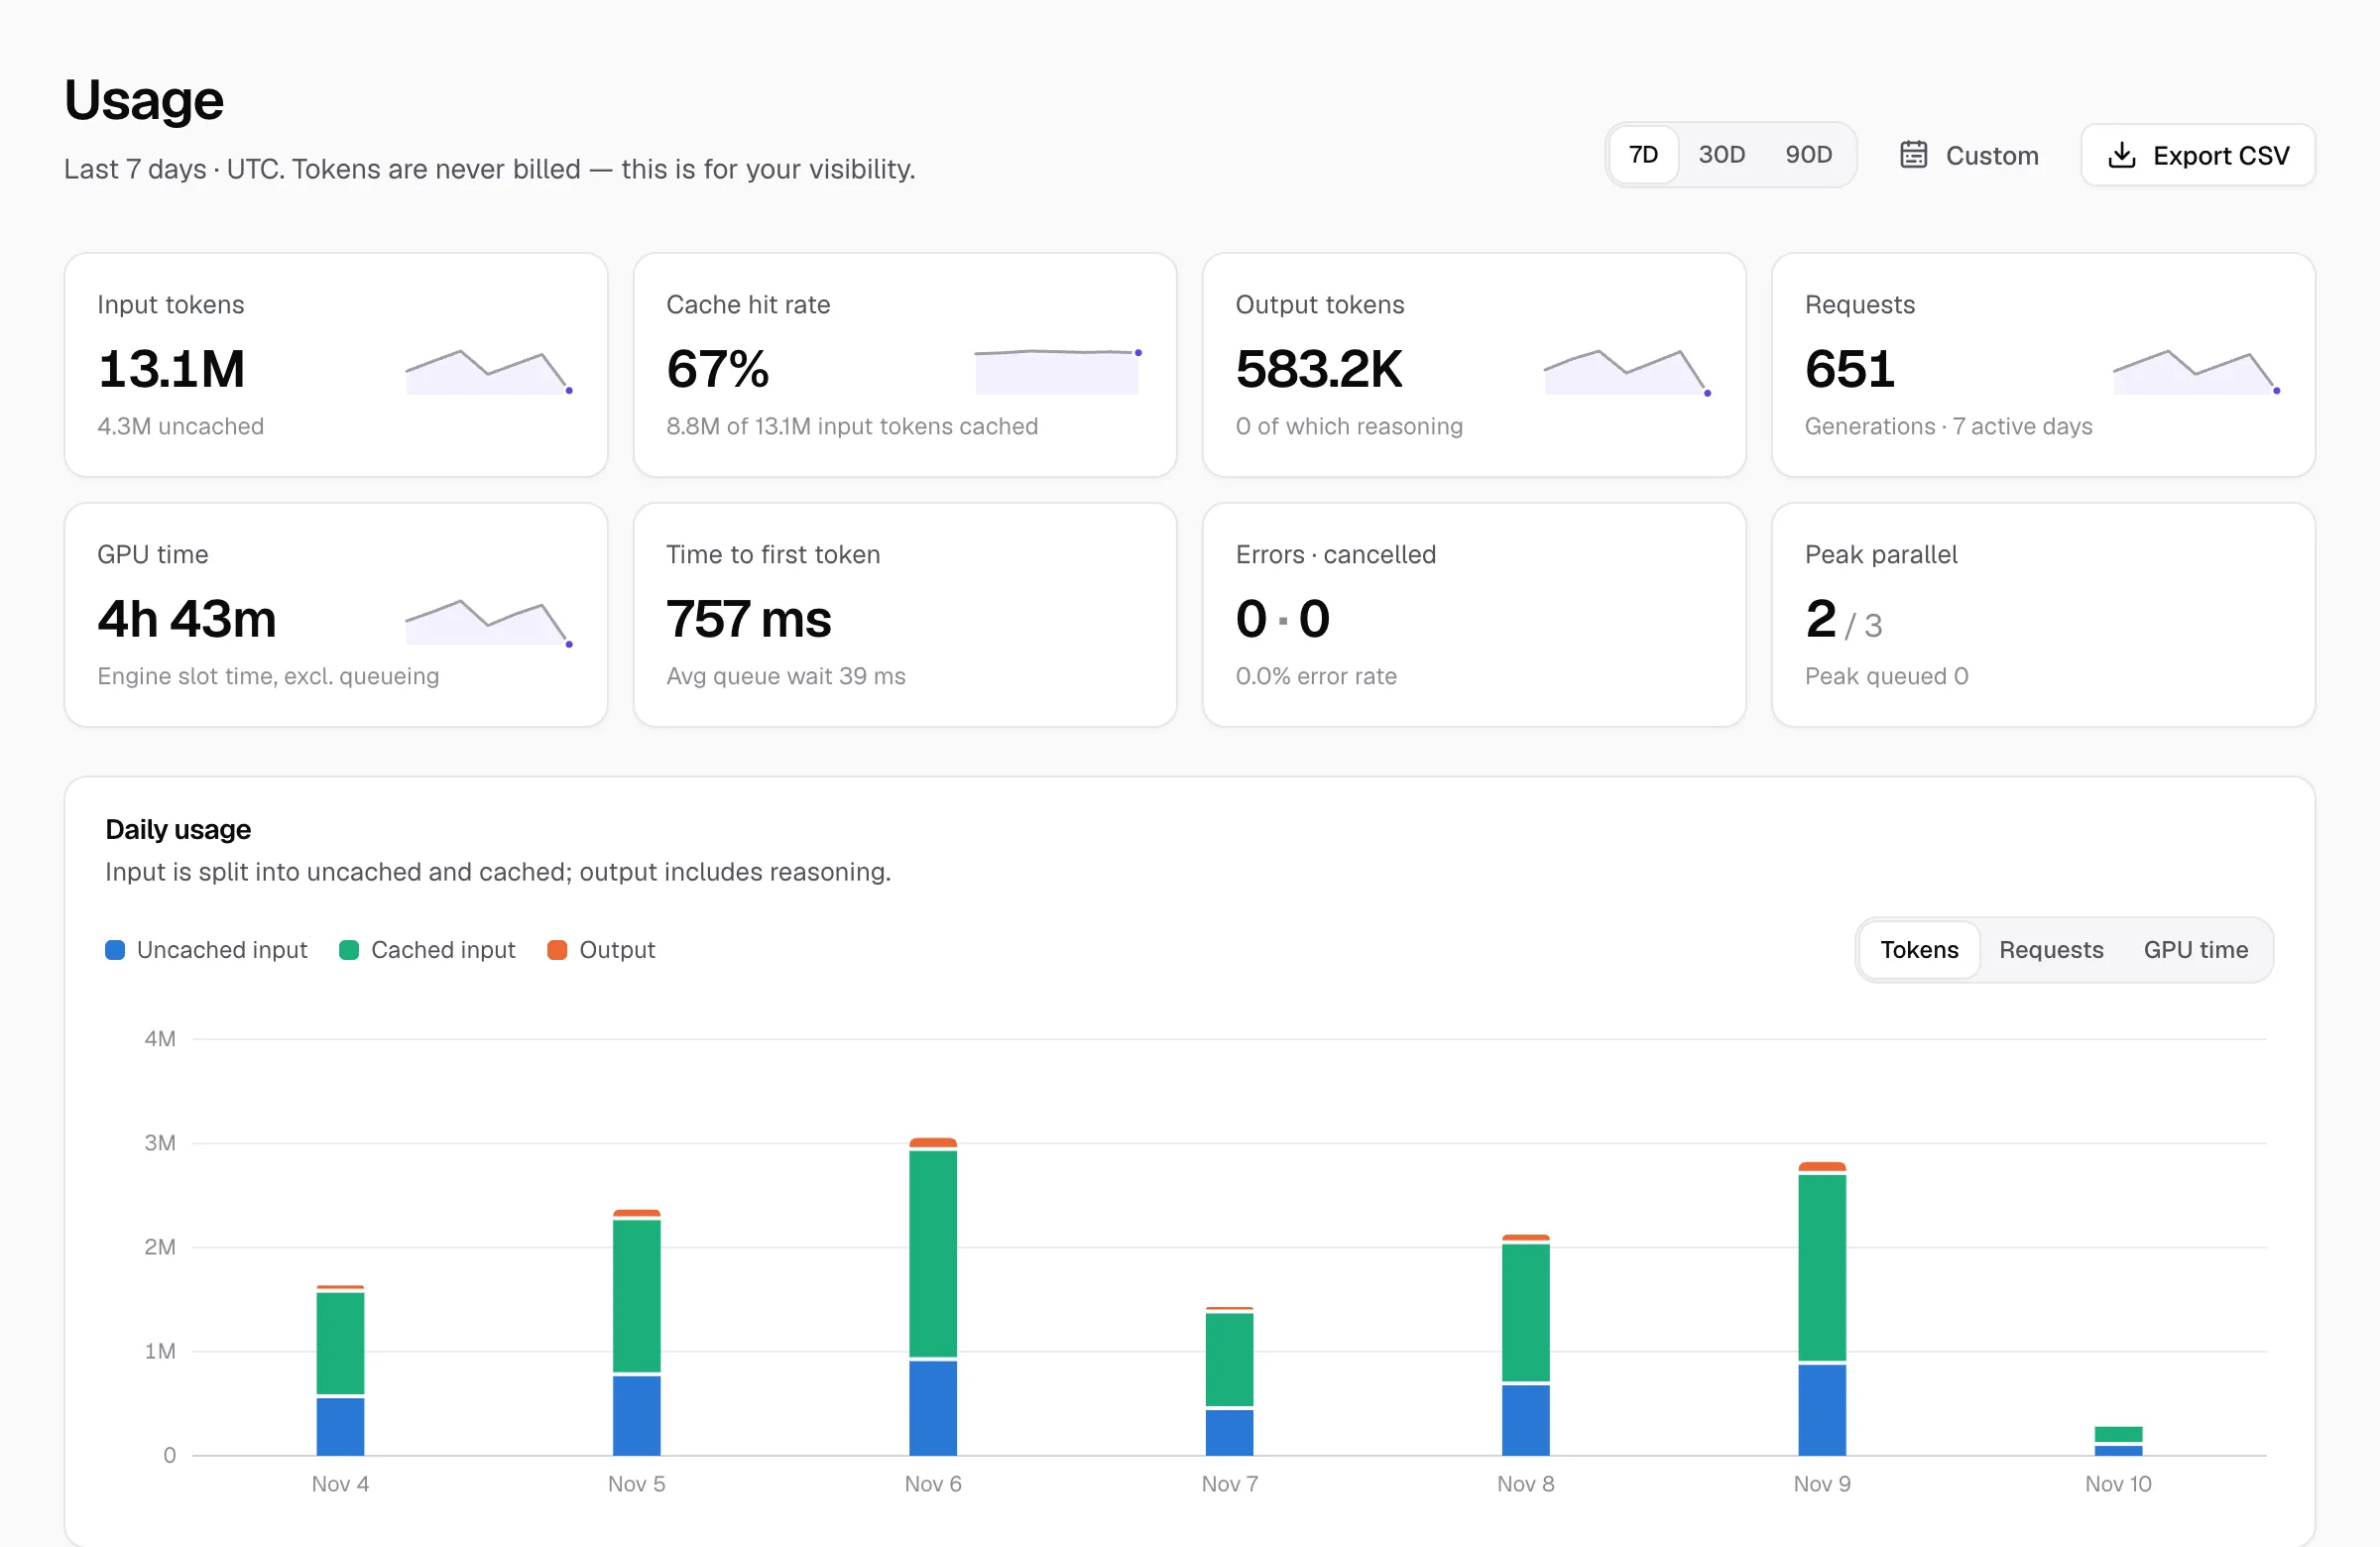
| Tile | What it tells you |
|---|---|
| Input tokens | Everything your tools sent to the model: your prompts, the files they read and the conversation so far. The line under it splits out how much was uncached. |
| Cache hit rate | The share of that input the model had already seen, so it was cheap to process again. Agents resend the conversation every step, so this is usually high. |
| Output tokens | What the model wrote back, including any reasoning. |
| Requests | How many generations ran, and on how many days. |
| GPU time | How long the model spent working on your requests, not counting time spent waiting in the queue. |
| Time to first token | How long from sending a request to the first word coming back. The line under it shows average queue wait. |
| Errors · cancelled | Requests that failed, and ones your tool cancelled. |
| Peak parallel | The most requests running at once, out of your plan's limit (for example 2 / 3), plus the most that were queued. See parallel streams. |
Use 7D, 30D and 90D to change the range, or Custom for exact dates. The chart can show tokens, requests or GPU time per day. Export CSV downloads what you're looking at.
The Requests page
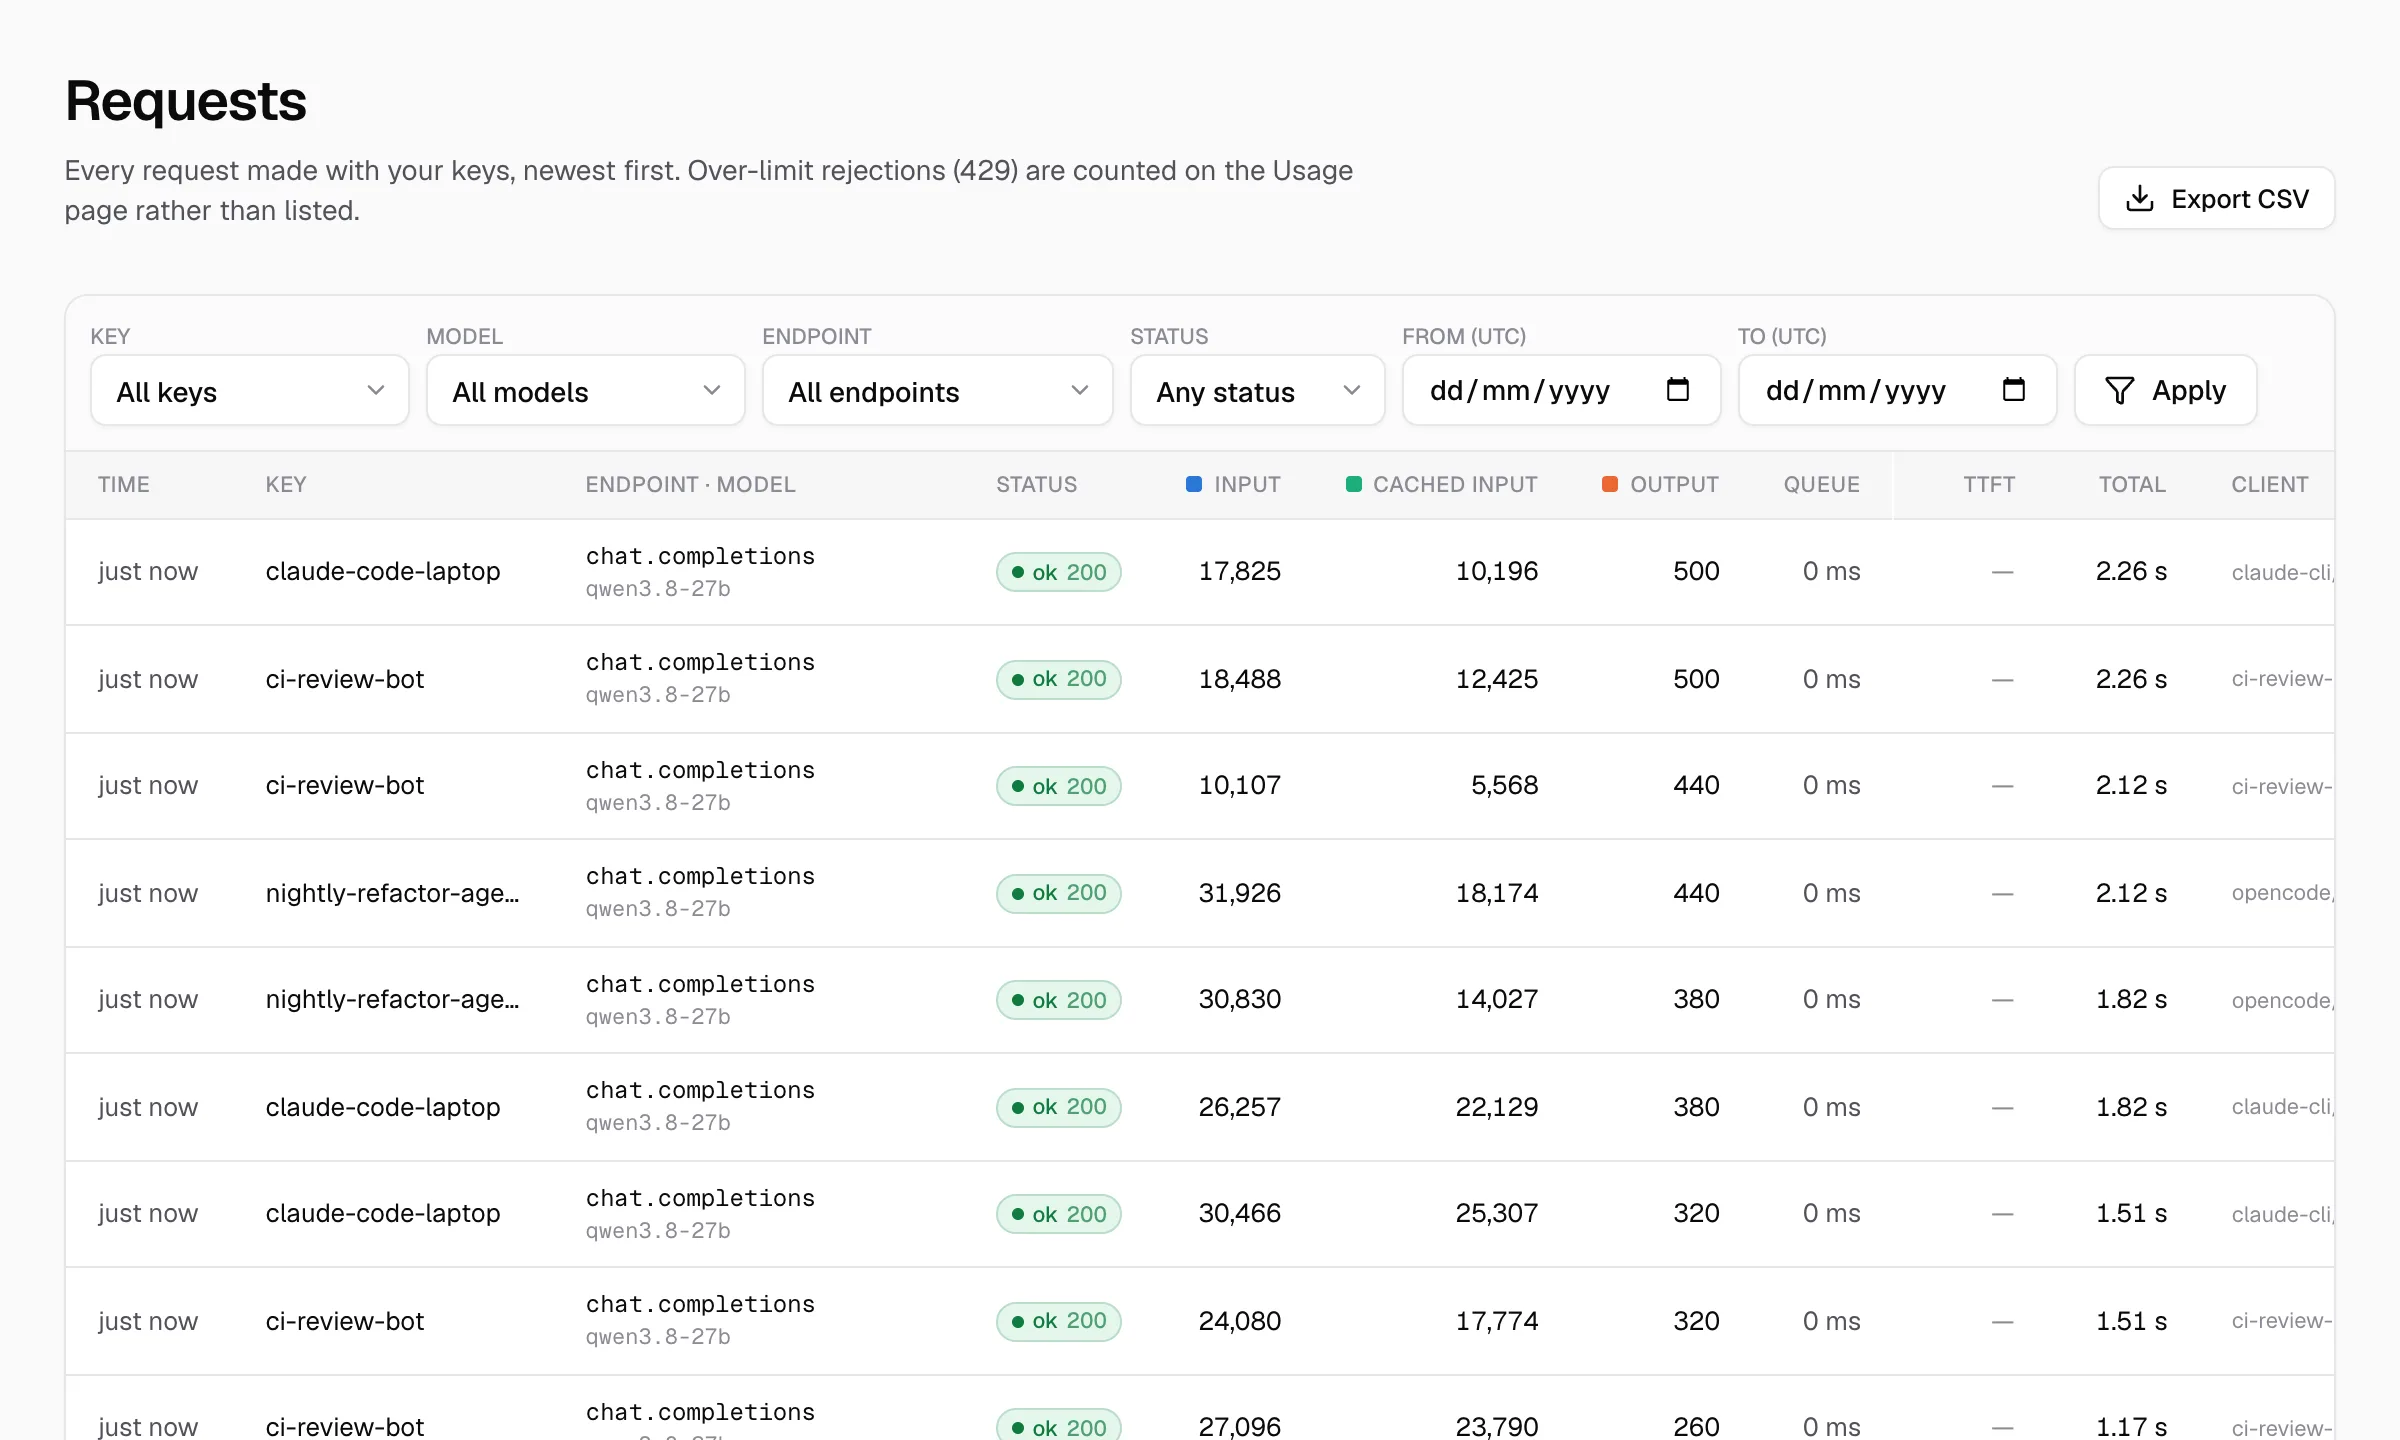
- Key: which API key made the call. If you gave each tool its own key, this tells you which tool it was. (See one key per project.)
- Endpoint · model: the API route used (
chat.completions,messagesand so on) and the model. - Status:
ok 200for a normal response, or the error code. - Input / Cached input / Output: token counts for that request.
- Queue: how long the request waited for a free stream. Near zero is healthy; a lot means you're at your limit.
- TTFT and Total: time to first token, and the whole request's duration.
- Client: the tool that sent it, as it identified itself.
Three things worth checking
- 1
Why did that feel slow?
Open Requests and look at Queue and TTFT for the slow request. A big queue means you were at your parallel limit; a big TTFT with no queue often means a very long prompt, which takes longer to read.
- 2
Which tool is using the most?
On Requests, filter by Key. With one key per tool, the filtered totals and the Client column show exactly who is responsible.
- 3
Do I need more streams?
On Usage, look at Peak parallel over a typical week. Sitting at the limit most days, or the banner telling you you're running into your parallel limit, means yes. Touching it rarely means no.
Are tokens billed?
Why don't I see my rejected requests on the Requests page?
Can I get this data into a spreadsheet?
- NeverMetered pricing and plan limits (checked 10 November 2026)